When writing up the results or research finding section of a survey report, be careful to describe the key data on the graph or figure. Avoid being too wordy but be concise and clear. Avoid interpreting and too many comments which should be reserved for the Discussion section of the survey report.
Page 1
Page 2
Page 3
Page 4
Rating Form
Task One
Choose which of the descriptions (A or B) best describes the key features of Figure 1 below
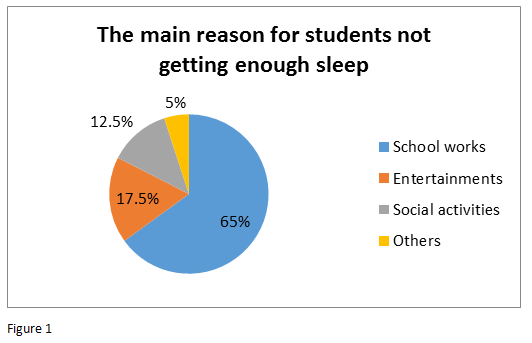
For those who thought they do not have enough sleep every day, they had answered what they think is the main reason of not having enough sleep (see Figure 1). Most of the respondents (65%) chose “school works” as their main reason. School works includes assignments, revisions, and presentations. Some interviewees (12.5%) chose “entertainments”, which includes surfing the net, playing video games etc., while some (17%) said they did not have enough sleep because of social activities such as chatting or going out with friends, skyping, instant messaging etc. Society activities and hall meetings were also the reasons for some students (5%).
For those stating they did not get enough sleep daily, they gave specific reasons for this (see Figure 1). The majority of the respondents (65%) choose ‘school work’. 12.5% of respondents chose ‘entertainment’ while 17% did not get enough sleep because of their social activities. Various meetings and societal activities made up the last 5% of the reason why students did not get enough sleep.
Better description is :
Reasons 'B' is better: More concise, includes necessary details, no missing key points, clear. Description ‘A’ adds interesting details and definitions for the various categories but these should be put in the discussion section. Focus on explaining what the data is not what the data means.
Your score is .
Task Two
Choose which of the descriptions (A or B) best describes the key features of Figure 2 below.
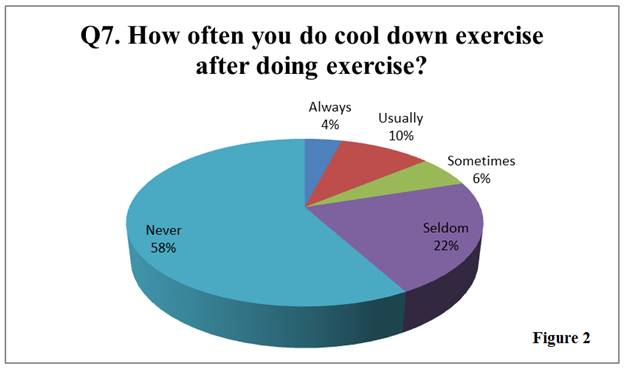
The respondents’ behaviors towards doing cool down exercises is shown in Figure 2. 58% of respondents ‘never’ do cool down exercises after exercising and 22% of respondents ‘seldom’ do cool down exercises. This means a total of 80% ‘seldom or never’ do any cool down exercises. On the contrary, only 20% of respondents do cool down exercises. 4% of them ‘always’ do cool down exercises. Respondents who ‘usually’ do cool down exercises occupied 10% of the total. 6% respondents ‘sometimes’ do cool down exercises.
The pie chart demonstrated that 58% of respondents never do cool down exercises after doing exercises and 22% of respondents seldom do cool down exercises. This means to sum up, 80% of them seldom or never do any cool down exercises. It is a large proportion. On the contrary, only 20% of respondents said they do cool down exercises. 4% of them always do cool down exercises. Respondents usually do cool down exercises occupied 10% of the total. 6% respondents sometimes do cool down exercises.
Better description is :
Reasons 'A' is better: The first sentence gives a brief, one sentence explanation of what the Figure is about. While B does not give a clear wording with the chart ‘demonstrating.’ ‘B’ also adds a comment ‘It is a large proportion’ which should be put in the discussion section. All necessary details are included in A and it is slightly clear. Punctuation of around choices also helps clarity.
Your score is .
Task Three
Choose which of the descriptions (A, B or C) best describes the key features of Figure 3 below.
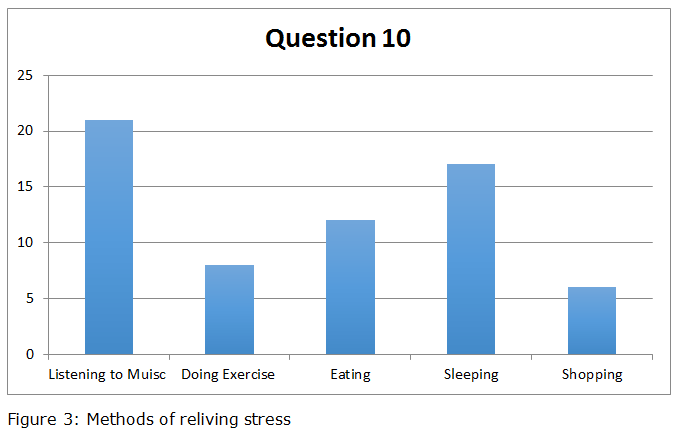
The bar chart in Figure 3 shows the methods used by respondents to relieve stress on their own. It can be seen that the most popular method was listening to music, which was chosen by 21 respondents. The second most popular method was sleeping, 17 respondents chose it. The least popular activity was shopping, only chosen by 6 respondents.
The bar chart in Figure 3 shows the methods used by respondents to relieve stress. The method most selected by respondents was listening to music, which was chosen by 21 respondents. The next method selected was sleeping, chosen by 17 respondents. The least selected activity was shopping, which was only chosen by 6 respondents.
Figure 3 shows the way respondents relieved stress. 21 respondents chose ‘listening to music’ which was the most selected method of stress relief. Next was ‘sleeping’ with 17 respondents choosing it and the least selected was ‘shopping’ with only six respondents selecting it. ‘Doing exercise’ and ‘eating’ were selected by eight and twelve respondents respectively.
Better description is :
Reasons 'C' is better: Eliminates some unnecessary words such as the bar chart. Adds missing data for two parts of data. Combines sentences where possible. More concise. Single digits put into word and putting single quotes around survey choices.
Your score is .
Task Four
Choose which of the descriptions (A, or B) best describes the key features of Figure 2 below.
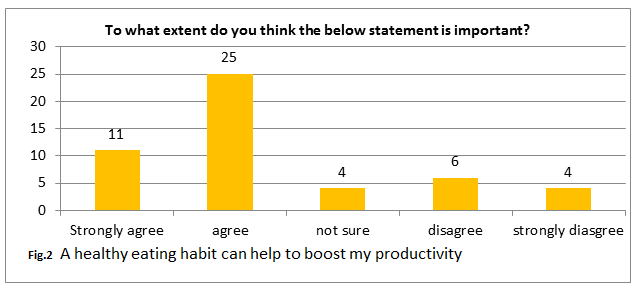
Moreover, when it comes to whether a healthy eating habit would be able to boost their productively, 22% of respondents answered “strongly agree”. Also, there were half of interviewees (50%) who chose “agree” as their answer. There were only a small amount of people who chose “disagree” or “strongly disagree”, which only accounted for 12% and 8% separately. Moreover, there were also a few people answered “not sure”, which was only 8% in total. (Fig.2) Noted that respondents who reported “strongly agree” and “agree” would be counted of approve the statement “I think a healthy eating habit can help to boost my productivity.” Oppositely, respondents who answered “Strongly disagree” and “disagree” would be regarded as disapprove the above statement.
In Figure 2 eleven out of fifty respondents (22%) ‘Strongly agree’ that a healthy eating habit can help boost productivity. Half of the respondents ‘Agreed’ while ten out of fifty (20%) selected either ‘disagree or strongly disagree.’ Four respondents selected ‘not sure’ to the statement.
Better description is :
Reasons 'B' is better: More concise and clear. ‘A’ has too many words and is confusing and rather hard to follow