 Hong
Kong Polytechnic University
 Hong
Kong Polytechnic University
MA in English Language Teaching
Computers in Language Teaching & Research
Week 12, Semester 1 1997/8
These pages are very much "work in progress". They are not intended to be in any way comprehensive but are rather intended to provide course participants with a chance to preview, review and extend the weekly class sessions.
To return to the Computers in Language Teaching & Research homepage, click here.
Aims
Students should become more aware of how to use Excel
for their research statistics in three areas:
Background
MA ELT dissertations often include the following
components:
The dissertation used as an example here has the above components. It is entitled:
An
Investigation into
Learners’ Disposition and Perceived Ability to
Learn Independently in the Centre for Independent Language Learning
There were four hypotheses:
Firstly, CILL students have a favourable disposition towards independent language learning in CILL because otherwise they would not attend. This will be confirmed if, on a one-to-four scale, the mean disposition of the students is greater than 2.5.
The second hypothesis is that students will, in general be satisfied with their perceived independent learning abilities in the CILL context. Again this will be confirmed if, on a one-to-four scale, the mean perceived independent language learning ability of the students is greater than 2.5.
The third hypothesis is that students’ disposition towards independent language learning and their perceived ability to learn independently will increase with the duration of their total attendance in CILL. This will be measured by correlating the above variables.
The final hypothesis is that further optional learner training and development opportunities will be wanted by the students. This will be investigated in the interviews.
Pilot Questionnaire One:
You need to pilot your questionnaire to check if the subjects
understand it, and to check if it is a reliable instrument. Here is the first draft of my
questionnaire:
Survey Form The aim of this survey is to investigate CILL students’ attitudes and abilities to learn English independently. The results of the survey will help CILL staff understand what independent language learning training CILL students want. Please write your CILL membership number here: __________. Your name will be kept confidential. Please circle 1 if you agree with statement (a) and not (b), circle 2 if you agree with (a) more than (b), circle 3 if you agree with (b) more than (a), and circle 4 if you agree with (b) and not (a). If you don’t know, circle DK in the box on the right.
Please circle a number to show how much you agree with the following statements: 4-Strongly Agree; 3-Agree; 2-Disagree; 1-Strongly Disagree; DK - Don’t Know
Thank you for your co-operation. |
After piloting the following revisions were made, based on students' and academics' feedback:
(Revisions in red, format changes in green)
Survey Form The aim of this survey is to investigate CILL students’ attitudes and abilities to learn English independently. The results of the survey will help CILL staff understand what independent language learning training CILL students want. Please write your CILL membership number here: __________. Your name will be kept confidential. Please circle 4 if you agree with statement (a) and not (b), circle 3 if you agree with (a) more than (b), circle 2 if you agree with (b) more than (a), and circle 1 if you agree with (b) and not (a). If you don’t know, circle DK in the box on the right.
Please circle a number to show how much you agree with the following statements: 4-Strongly Agree; 3-Agree; 2-Disagree; 1-Strongly Disagree; DK - Don’t Know
Thank you for your co-operation. |
Reliability
To check the
reliability of the questionnaire, the
format and/or order, but not the wording, of some of the
questions was changed, and the questionnaire re-administered to
the same subjects.
Survey Form The aim of this survey is to investigate CILL students’ attitudes and abilities to learn English independently. The results of the survey will help CILL staff understand what independent language learning training CILL students want. Please write your CILL membership number here: __________. Your name will be kept confidential. Please circle 4 if you agree with statement (a) and not (b), circle 3 if you agree with (a) more than (b), circle 2 if you agree with (b) more than (a), and circle 1 if you agree with (b) and not (a). If you don’t know, circle DK in the box on the right.
Please circle a number to show how much you agree with the following statements: 4-Strongly Agree; 3-Agree; 2-Disagree; 1-Strongly Disagree; DK - Don’t Know
Thank you for your co-operation. |
This was done after an interval of a week, so reduce the chance of the subjects remembering their previous answers, so forcing them to consider the questions carefully again. If the interval is too long, the subjects may have experiences that alter their answers.
The purpose of re-administering the questionnaire is to check whether the same questions will produce the same or similar results. If not, you do not have a good questionnaire, and you should check with your subjects why they chose different answers, then improve the questions.
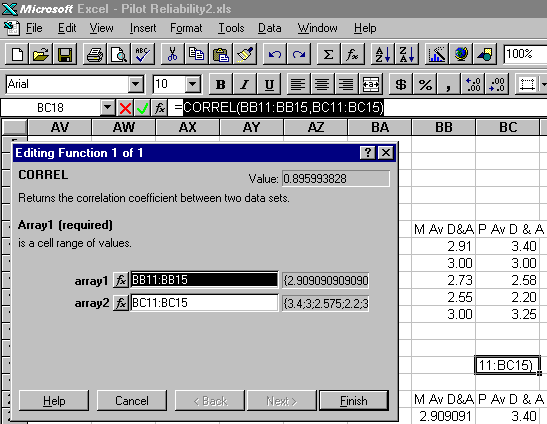
Correlations for the same question on the two different questionnaires were worked out. A questionnaire is more reliable if the correlations are at or near one. Zero means no correlation, and minus one means a negative correlation.
In class we will look at how to make Excel do correlations. It's very easy.

Then click 'Finish'. The correlation will appear in your sheet in the cell you selected.
Correlation
To test Hypothesis Three (that students’ disposition towards
independent language learning and their perceived ability to
learn independently would increase with the duration of their
total attendance in CILL), the degree of correlation between was
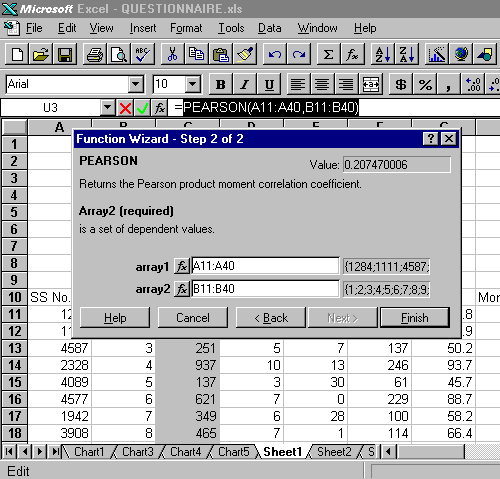
analysed by using Pearson’s Product-moment correlation
coefficient.
Pearson’s Product-moment correlation coefficient was chosen following the guidelines in Brown (1988: 130 - 153). There are four assumptions involved in choosing this method. Click here to read about them.
In class we will look at how to make Excel do Pearson's. It's very easy.

Then click 'Finish'. The correlation will appear in your sheet in the cell you selected.
Graphs
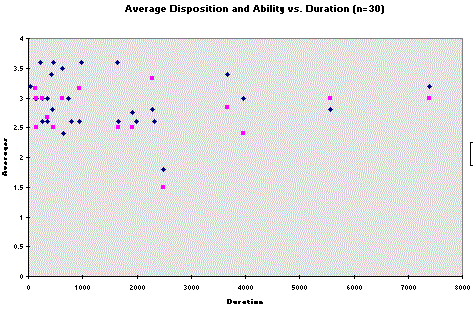
It is better to show the correlation (or lack of it) with
statistics, rather than with a graph, although a graph is good
for giving a graphic image of the distribution of scores over
time:

Excel graph of Average Disposition and Ability
(Vertical Axis) vs. Duration (Horizontal Axis)
(How to make this graph, using the ChartWizard in Excel, will be
shown in class.)
Notes:
Pearson’s Product-moment correlation coefficient assumptions:
Firstly, it is assumed that each pair of scores is independent from all other pairs. In the questionnaire results, the pairs of duration and mean total disposition and perceived ability are independent because each pair is from a different student.
Secondly, the two variables, in this case firstly the total duration of the student’s attendance in CILL measured in minutes and secondly the mean total disposition and perceived ability, should be normally distributed, i.e. not skewed. For the duration figures the range of the times contains over four standard deviations, although the mean is only about one standard deviation from the minimum due to the cluster of students with only a few visits and therefore shorter durations. For the mean total disposition and perceived ability, 5.3 standard deviations can be fitted into the range, with the mean close to the middle of the range. Therefore it can be concluded that the skewedness of the figures is low and the distribution is normal.
The third assumption is interval scales, and the duration is measured in time intervals of minutes.
The fourth and final assumption is a linear rather than curvilinear relationship between the variables. This means that the points on the graph should be in a straight line (see the graph above), not a banana-shaped one.
Brown, James Dean (1988) Understanding Research in Second Language
Learning: a teacher’s guide to statistics and research
design Cambridge: Cambridge University Press
(This book will probably be on your reading list for the course
in Research Design next semester.)
Definitions:
This is one questionnaire taking a 'snap-shot'
- an image of a situation at one point in time.
N.B. These still have to be piloted.
Pre- and post treatment/experiment
Subjects (eg. students) are questionnaired both before and after some type of experiment or treatment, for example they might be questioned about their attitudes to self-access learning before and after a self-access course to see if their attitudes become more favourable.
These questionnaires have to be piloted.
Disposition is defined by The Collins Cobuild Dictionary (1995 :477) as "Someone’s disposition is the way they tend to behave or feel." and " a willingness to do it".
For the purposes of this investigation, ‘disposition’ is defined as ‘the learners’ opinions and beliefs about independent language learning’.
Perceived ability in this investigation is defined as the CILL students’ own judgment of their ability to learn independently. This investigation looks at students perceptions of their own ability, rather than an external assessment, in accordance with Holec’s (1980: 32 - 4) opinion that, in self-directed learning, the learner should decide the level of competence aimed for.
"Learning in which an individual or group of learners study on their own, possibly for a part of parts of a course, without direct intervention from a tutor. This can involve learners in taking greater responsibility for what they learn, how they learn, and when they learn. It can also lead to learners being more involved in their own assessment. Independent learning is likely to be most effective when at least some support is available."
Jeffries, Clive et al. (1990) A-Z of Open Learning National Extension College Trust